Executive Stars Storytelling Dashboard
Strategic board-level reporting for Star Ratings performance
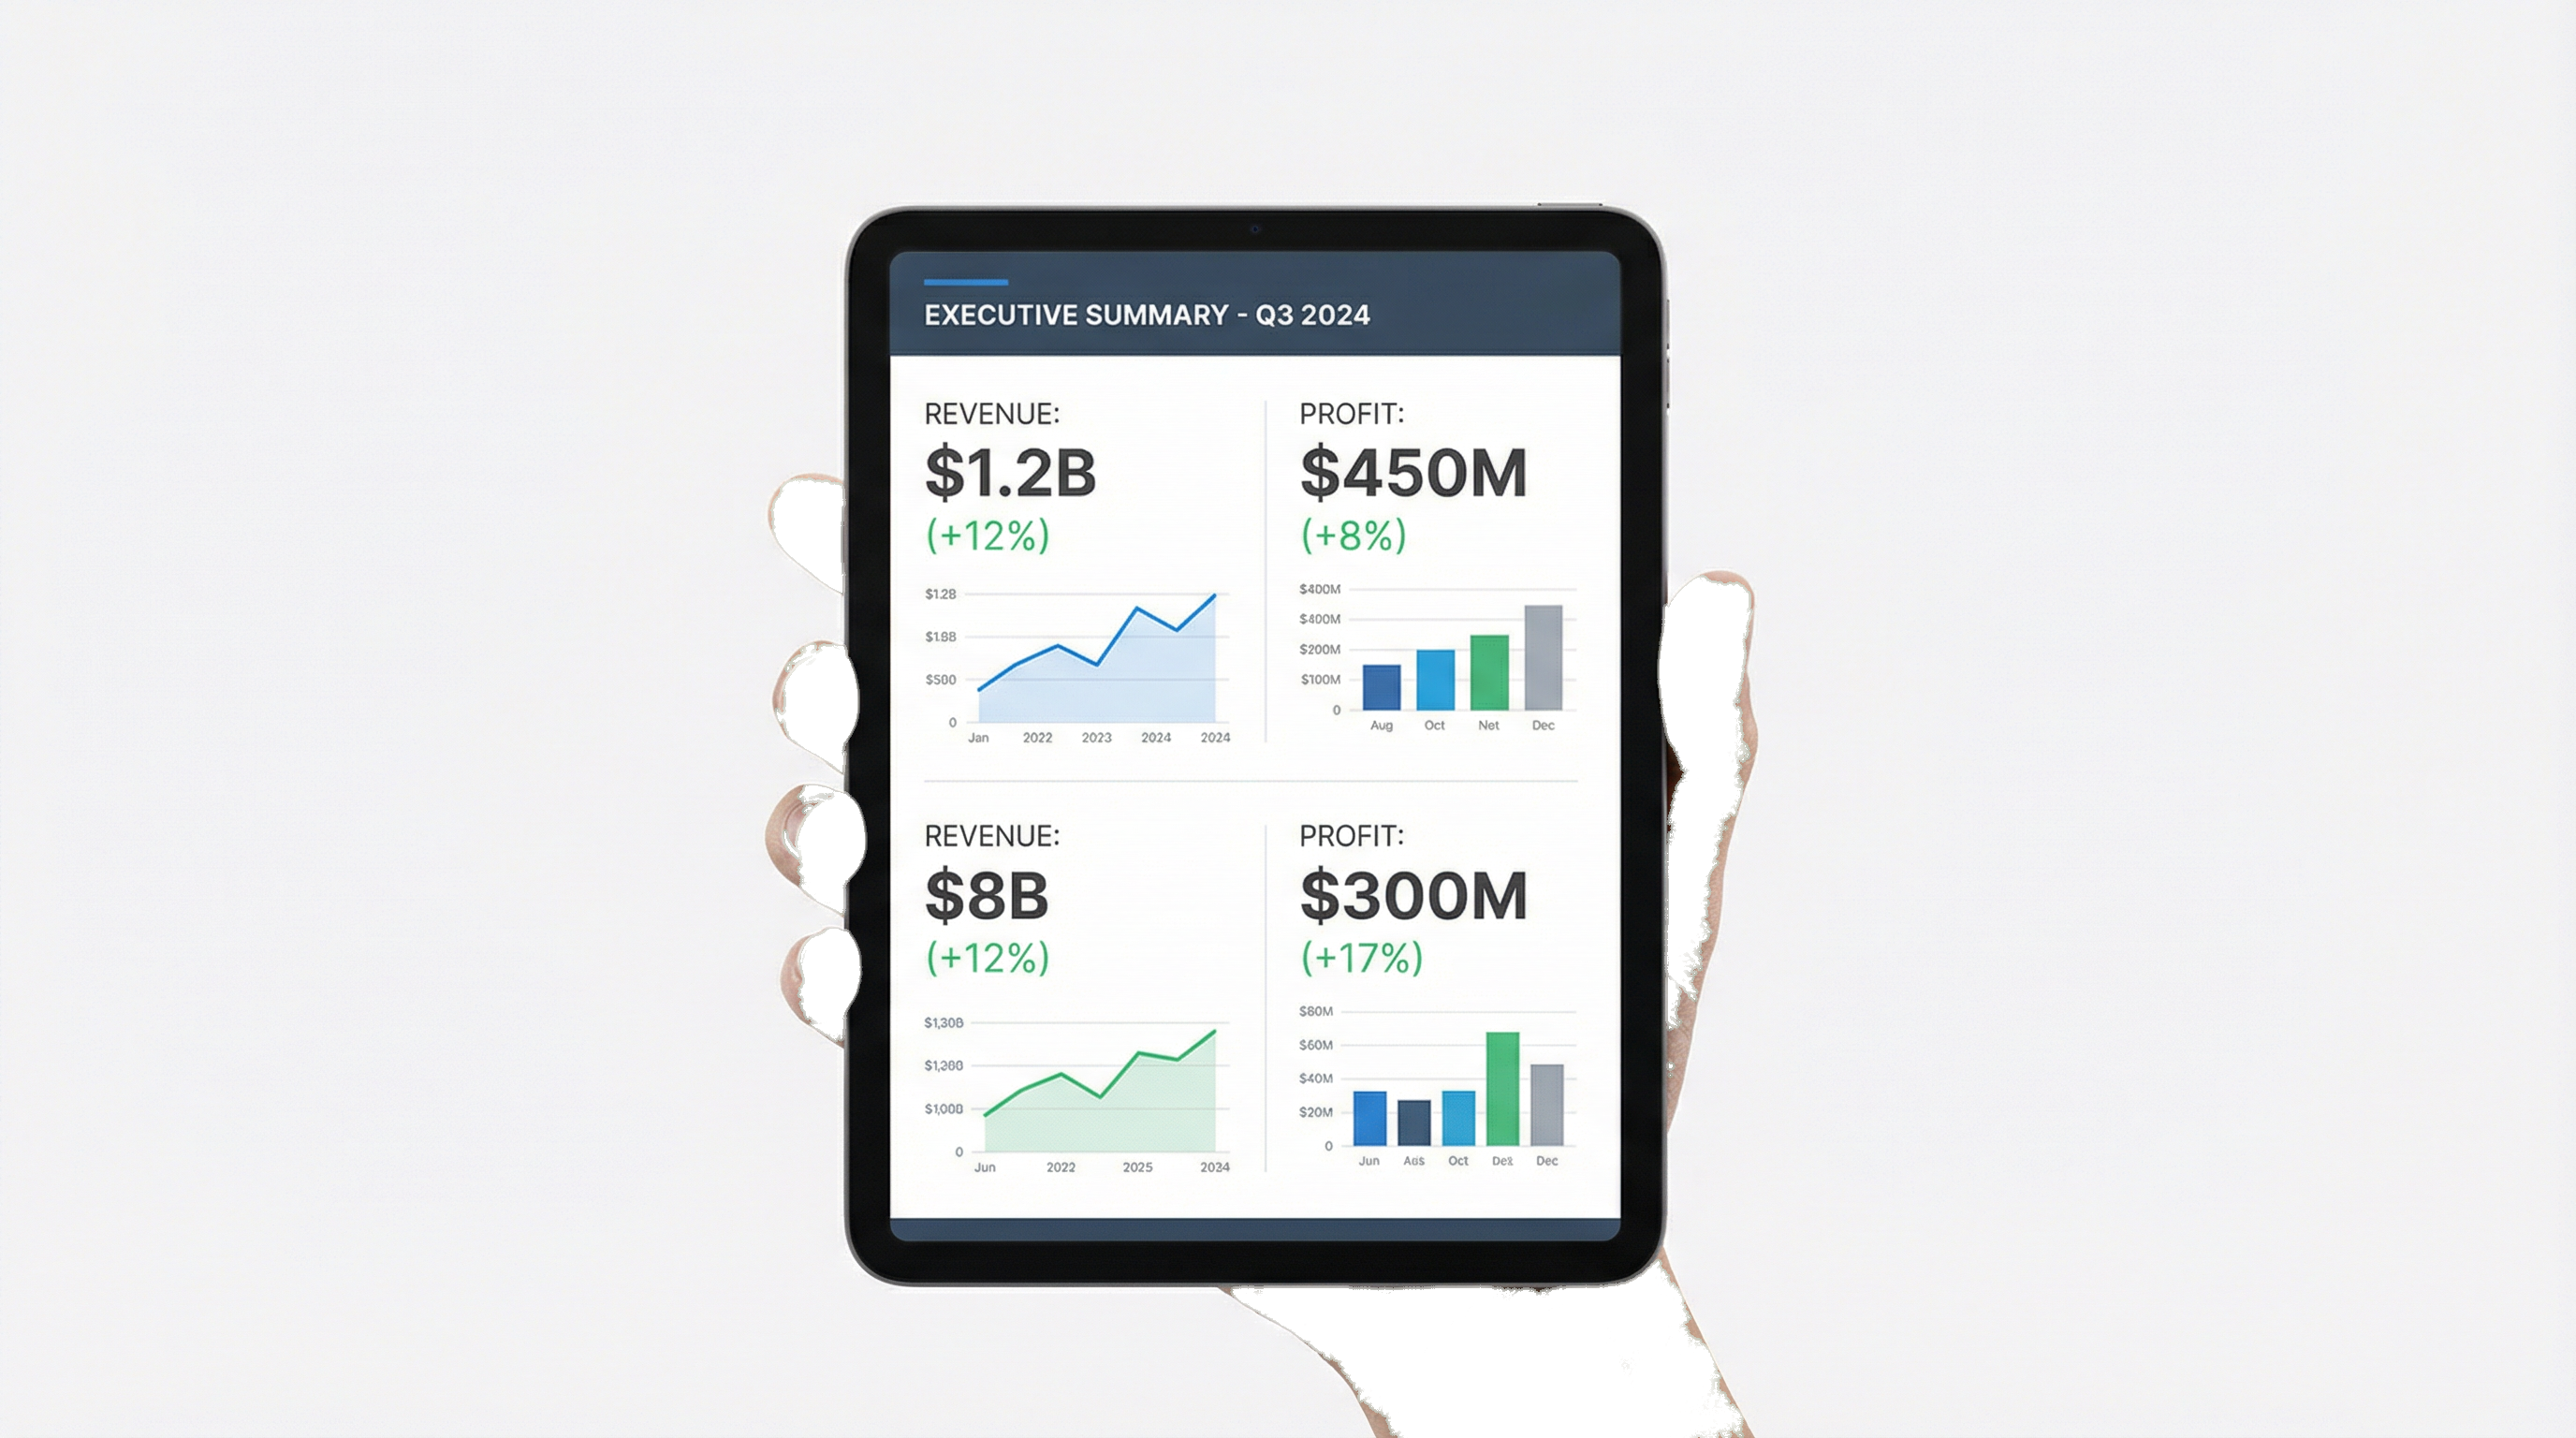
Project Overview
A high-impact executive dashboard designed to communicate Star Ratings performance to non-technical stakeholders. It moves beyond simple charts to provide a narrative-driven view of performance drivers, financial impact, and strategic recommendations.
The Challenge
Executives were overwhelmed by dense spreadsheets and complex technical reports. They needed a clear, 'at-a-glance' view of where the plan stood and what actions were needed to achieve a 4-Star rating.
Key Results
- Adopted as the primary monthly reporting tool for the C-suite Quality Committee.
- Reduced time spent on manual report preparation by 15 hours per month.
- Facilitated faster decision-making on resource allocation for underperforming measures.
Technical Solution
- 1
Designed a 'Board Deck' style layout that prioritizes key insights and recommendations over raw data tables.
- 2
Implemented 'What-If' scenario modeling to show the potential impact of specific interventions on the overall Star Rating.
- 3
Created clear visual indicators for 'On Track', 'At Risk', and 'Critical' measures based on predictive cut points.
- 4
Automated data refreshes to ensure leadership always had the most current view for decision-making.